Triggers for Automatic Horizontal Scaling
Apiqcloud allows you to automatically scale your projects horizontally, changing the number of web/application server nodes in your environment. All of the newly added nodes are created at different hardware servers, ensuring even more reliability and high-availability.
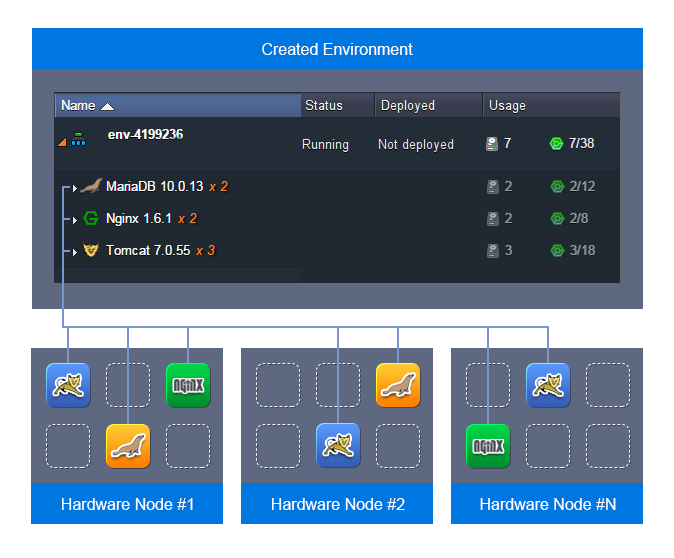
Automatic horizontal scaling can be implemented by means of tunable triggers, which will monitor the changes in application’s load and increase or decrease the amount of nodes due to them. In order to find out how to automate the horizontal scaling operations for your application server and track their occurrence, refer to the appropriate instructions below:
1.Setting triggers for automatic scaling
2.Triggers' execution history
Note: For the rest types of stacks (i.e. placed within non-application server layer - databases, load balancers, etc), you can define to get the appropriate notifications upon their load changing and adjust the number of containers manually according to them.
1.Triggers for Automatic Scaling
Apiqcloud horizontal scaling allows you to configure automatic changing of the web/application server nodes’ number according the resources consumption of your application. You can set the minimum and maximum allowed amount of nodes, as well as the conditions for their addition or removal, by means of tunable triggers. There are five types of monitoring triggers available, which are based on the usage of a particular resource type such as :
CPU
Memory (RAM)
Network
Disk I/O
Disk IOPS
You simply need to state the percentage of the resource consumption limit (or, possibly, a particular level of Mbps usage for Network trigger) and the time period the load should stay under/above it. After enabling, the trigger instantly starts to monitor the amount of resources your application consumes.
When the usage level exceeds the stated limit, a trigger becomes invoked. Subsequently, it will be executed if the amount of consumed resources will stay out of the specified limit for a defined period of time. In this case, the number of server nodes will go up or down.
Note:
Each newly added node has the same cloudlet limits as the already existing one
NGINX-balancer server is added to the environment automatically with the default minimum cloudlet limits once the number of nodes becomes more than one. When the nodes are removed (so that just one is left), the added balancer will remain present in the environment with all configurations
The initial (master) node of the layer can be used as a storage server for sharing data within the whole layer
So, to configure a trigger for the automatic horizontal scaling, follow the next steps:
1. Click the Settings button for the desired environment.
2. In the opened tab, navigate to the Monitoring > Auto Horizontal Scaling section.
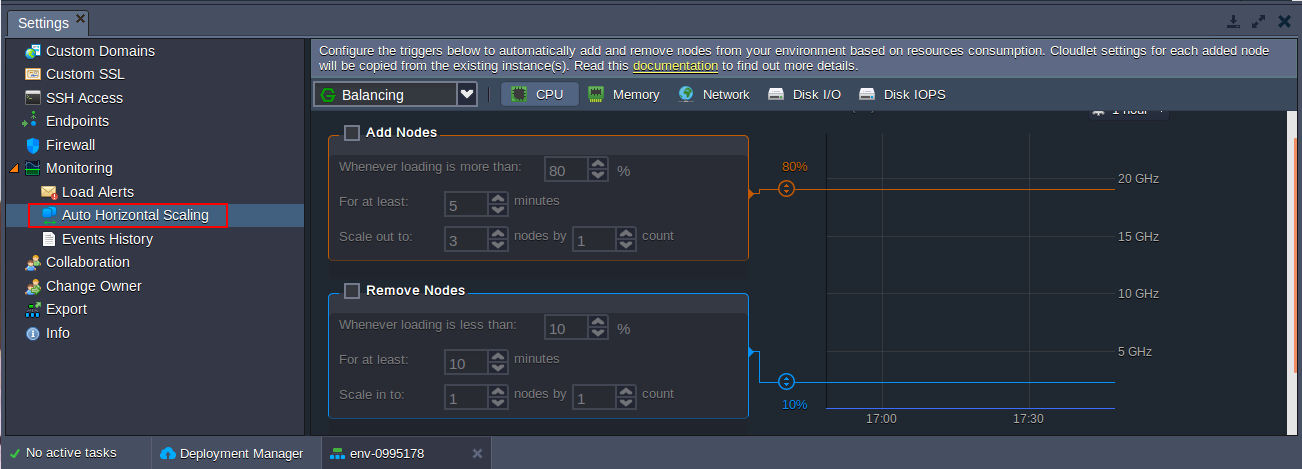
3. Choose one of the tabs at the top pane with the resource type, that is required to be monitored.
Tip: Percentage for both CPU and Memory monitoring triggers’ execution is calculated based on the amount of the allocated cloudlets (a special Apiqcloud resource unit, which represents 400 MHz CPU and 128 MiB RAM simultaneously).
Change the Turned switcher position to ON in order to be able to tune the Add/Remove Nodes trigger's conditions.
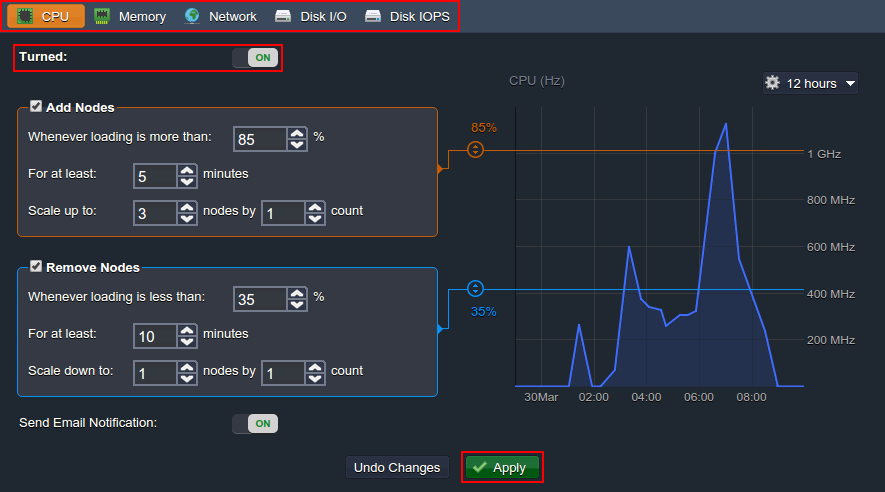
Note: The trigger becomes active only after it’s enabled with the Turned switcher and conditions parameters are Applied.
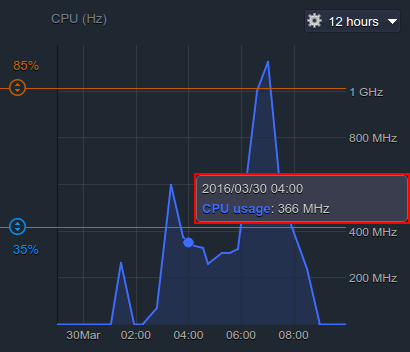
4. In the right part of the section, you can see the graph, which shows the statistics on the chosen resource consumption.
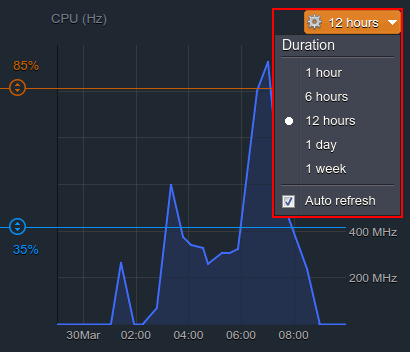
It stores and displays information on application’s performance for the last week. You can choose an exact time period you are interested in using the drop-down list above the graph. Also, here you can enable/disable the statistics’ Auto refresh function.
5. Hover over a particular point of the graph to see the exact amount of resourceconsumption for the chosen moment of time. This information can be used for setting proper conditions for triggers’ execution.
6. Each trigger has two options (i.e. Add and Remove Nodes), which can be enabled with the corresponding check-boxes right before the title.
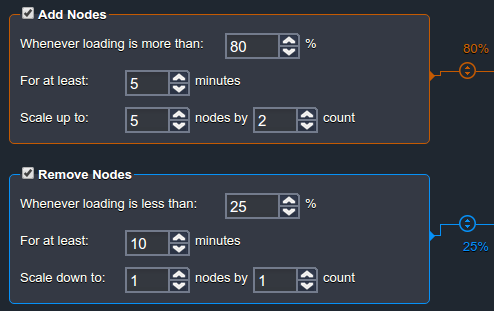
After being turned on, each of them can be configured in a similar way using the following options:
Whenever loading is more (less) than - the upper (lower) trigger limit in percentage (or Mbps for Network), based on which it will be invoked. The required magnitude can be also stated with the help of the appropriatesliders to the right.
Tip: The 100% value will automatically disable the Add Nodes trigger, while stating 0% will turn off the Remove Nodes one.
For at least - the amount of minutes a trigger should remain invoked before alteration of the nodes' count. Can be configured up to one hour with a 5 minutes step (i.e. 1, 5, 10, 15, etc.)
Scale up (down) to - the maximum (minimum) number of app server nodes, that can be stated within the application server layer due to automatic horizontal scaling
Scale by - the count of nodes that are to be added/removed at a time upon trigger's execution
7. As an addition, Apiqcloud gives you the possibility to receive email notifications on horizontal scaling events. This option is enabled by default upon activating any of triggers; nevertheless, you can easily disable it using the corresponding Send Email Notifications switcher.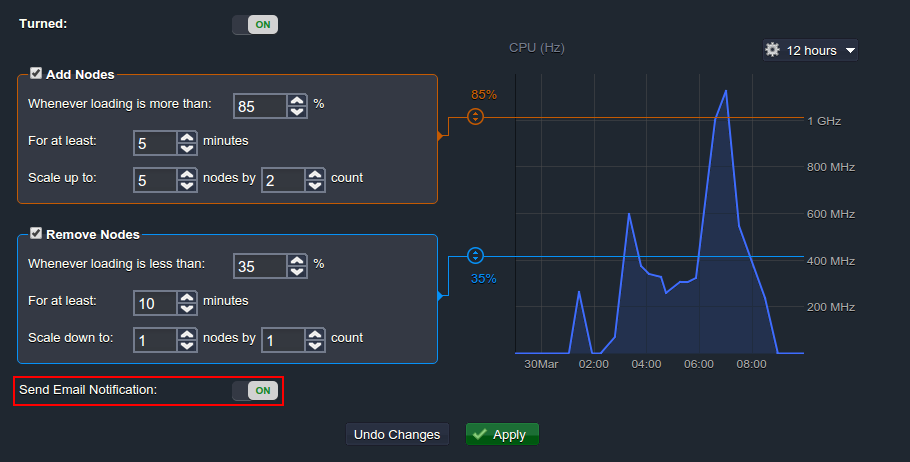
In case it is enabled, you will receive the appropriate email message every time any of your triggers is executed. It will provide an information on the current consumption level of a particular resource and the number of nodes that were added or removed.
8. Lastly, you need to Apply the changes in order to save your trigger(s) configurations (or, if it’s required, you can Undo Changes with the same-named button and return to settings you’ve used before).
![]()
2.Triggers Execution History
You can also view the history of triggers' execution for a particular environment.
1. Navigate to the Monitoring > Events History section and choose the Horizontal Scaling type within the corresponding drop-down list at the top pane.
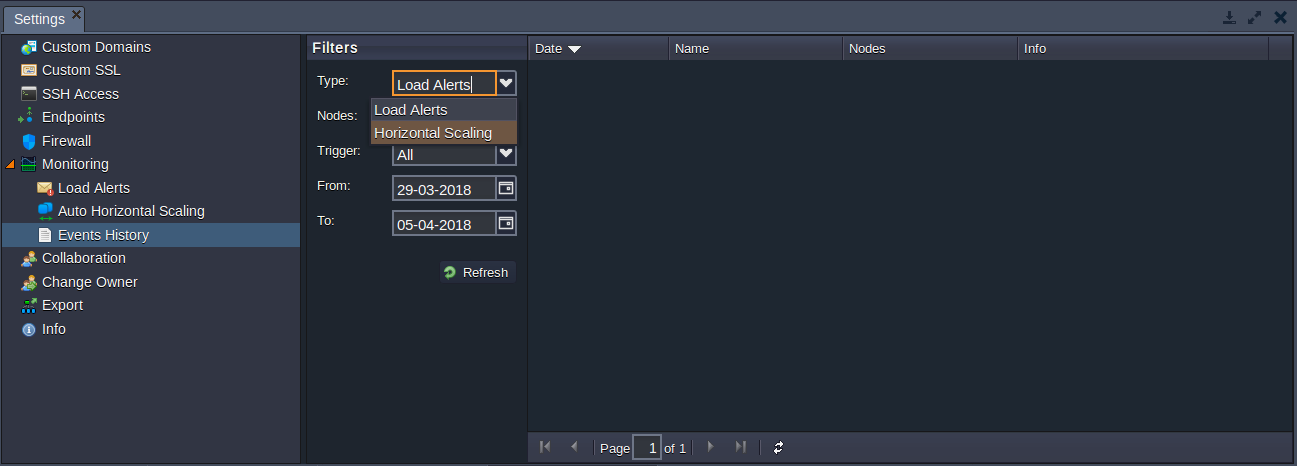
2. Define the period of time the history should be displayed for using the Period drop-down list.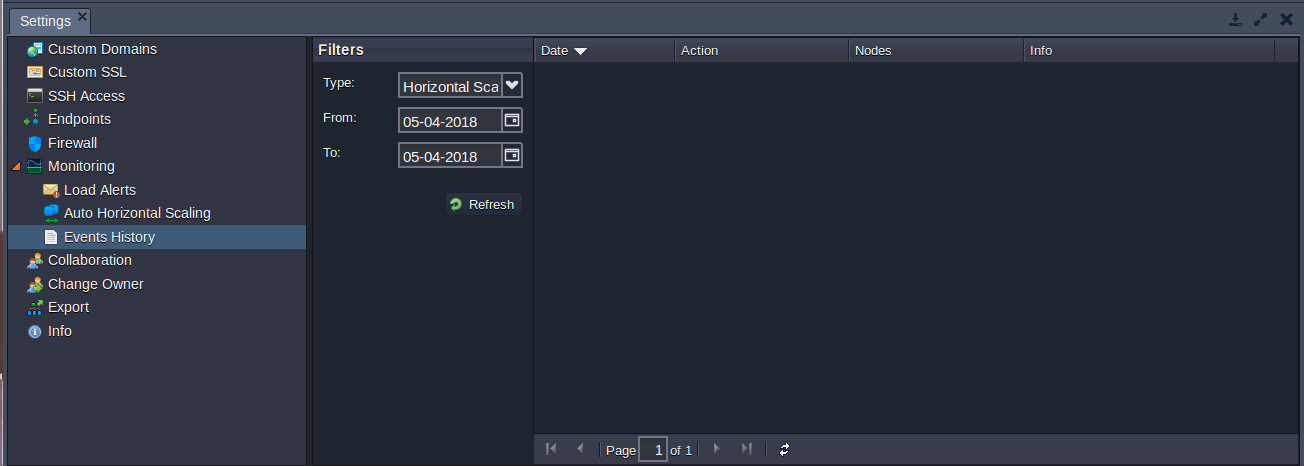
You can also choose the custom value and specify the required dates manually.
3. You’ll see the list of trigger(s) executions, which occurred during the stated period, with the following details:
Date and time when a trigger was executed
Action performed (adding or removing nodes)
Nodes type the scaling has been applied to
Condition of trigger execution you’ve specified
Result of execution (either success or failure)
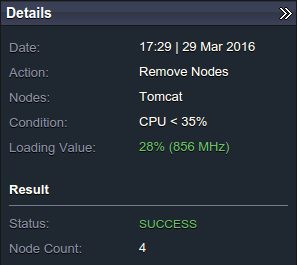
4. Click on a particular record to open the Details panel to the right, which provides some additional information:
Loading Value - an exact level of resource usage for the time of trigger execution
Node Count - the number of app servers in the environment after the chosen trigger’s execution
In this way, you can configure a set of horizontal scaling triggers and track their executions in order to not to worryabout your app performance. Enjoy!
In case you have any questions left, feel free to appeal for our technical experts’ assistance at Stackoverflow.

